

Goodhart's law states that whenever a measure becomes a target, it ceases to be a good measure. Charles Goodhart, a British economist, was thinking of the United Kingdom's economic policies when he was credited with the expression in 1975, but the same principle can be applied to education.
One of the main objectives of any school is to teach students subjects such as mathematics or history. But measuring just how much students learn is hard, so educators have come to rely on grades.
Anyone who took Goodhart's idea seriously might have predicted what came next: grade inflation. Eager to please both parents and policymakers, American schools have been slowly lowering standards when it comes to grades, giving out more A's—and fewer C's—over time.
HeyTutor looked at data from ACT Inc., which administers the eponymous exam, to track how much high school grades have inflated over time. Their latest research, based on students who have registered for the ACT exam, shows that grade point averages for high school English courses rose from 3.3 for the graduating class of 2010 to 3.41 for the graduating class of 2022. Math grade point averages rose even more during this same period, from 3.19 to 3.36. Meanwhile, scores on the ACT exam stayed flat, indicating the possibility that students are now getting better grades not because they have learned more, but because their schools are going easy on them.
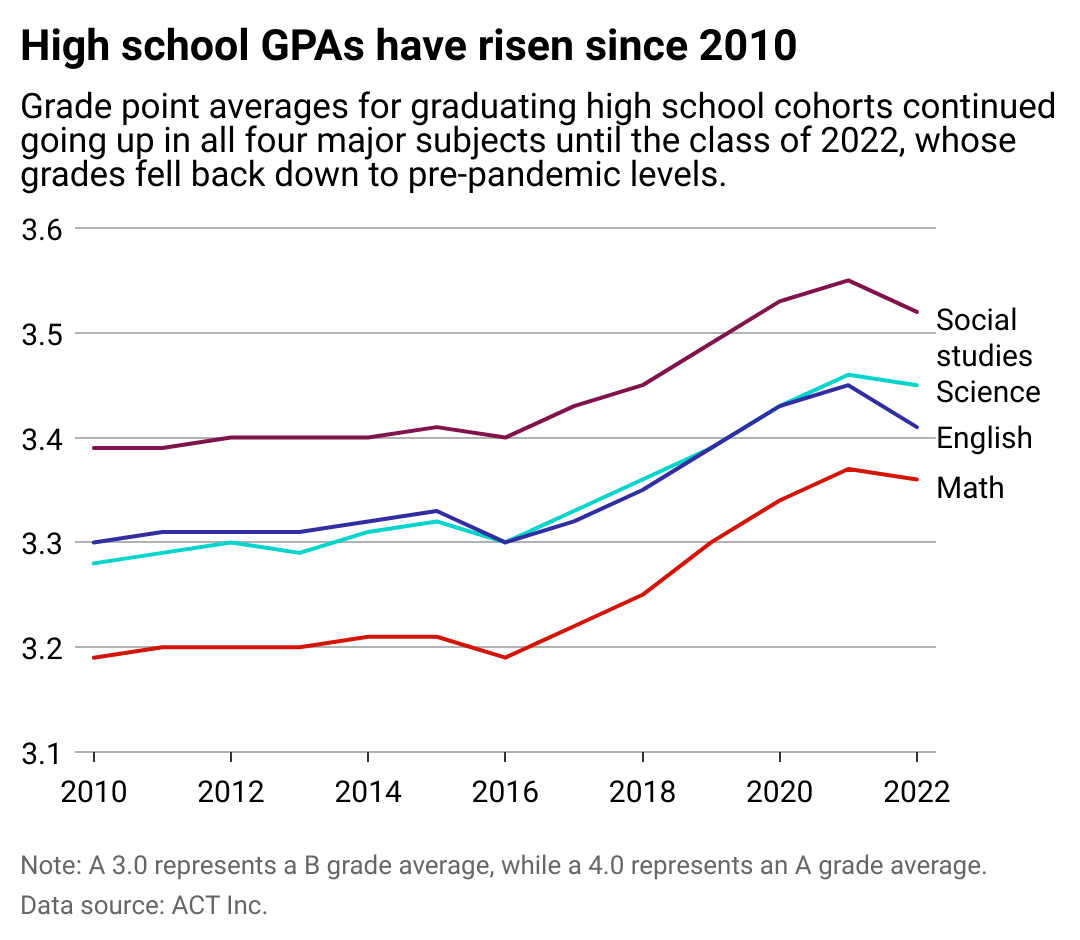
High school grades rose at the fastest rates in mathematics and science, and at a slower rate in English and social studies, between 2010 and 2022. Scores on the ACT exam, however, fell in all corresponding subjects during the same period.
ACT Inc.'s data also shows that grades fell between 2021 and 2022. However, numbers from these two years can be difficult to interpret, since these two cohorts potentially took their courses remotely during the COVID-19 pandemic.
The ACT report notes that in spring 2020, some schools barred failing and implemented rules preventing students from receiving course grades they had prior to the pandemic. Moreover, the share of high school graduates who took the test fell from 46% for the class of 2020 to 35% for the class of 2021. This means that grades and test scores received during these years may not be fully comparable to those of prior years.
The trend of grade inflation goes back far earlier than 2010. Research published by the Department of Education found that the average high school GPA rose between 2.68 in 1990 to 3.0 in 2009. Similarly, another study published by the Higher Education Research Institute at the University of California, Los Angeles, found that the share of college freshmen with an A or A+ grade average in high school rose from 13.4% in 1985 to 31.2% in 2015.
Grade inflation can have some real impacts on students pursuing higher education. For one thing, inflated grades mean that colleges have less information about applicants, as admissions offices often rely on high school transcripts. If every student has all A's on their report cards, colleges might have a harder time figuring out who the best students are.
Grade inflation can also give parents a misleading view of their children's academic progress. A recent report from Gallup surveyed 2,000 American parents and found that 79% were receiving B's or better, and 61% believed that their children would be "well-prepared" for college by the time they graduated from high school. Yet, data from the ACT shows that just 40% of high school seniors meet "college readiness benchmarks" in reading, while only 30% hit "college readiness benchmarks" in math.
Story editing by Ashleigh Graf. Copy editing by Tim Bruns.
This story originally appeared on HeyTutor and was produced and distributed in partnership with Stacker Studio.